April 29, 2011

Resource Scarcity and the China Bubble

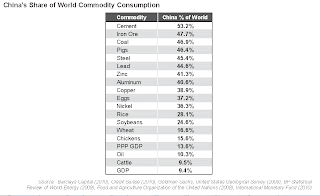
Though resource scarcity is often considered abstractly, its immediate future--certainly over the next decade and probably well beyond unto the distant future--is bound up with China's extraordinary rise. China's prodigious appetite for natural resources has been the fons et origo of the commodities boom over the past decade.

Yet there are strong indications that China stands in a fully developed stage of bubbledom, of which there are many symptoms. In commercial real estate, as Jim Chanos and Hugh Hendry have emphasized, there are lots of developments that have no income stream. The disparity between average incomes and real estate prices are in excess of those prevailing in Japan before 1989 (a point examined by Edward Chancellor in reports for GMO)  If the Chinese investment boom is followed by a big bust, it will profoundly affect both prices and perceptions. Falling prices would also ease perceptions of future scarcity and would, at least in the medium term, greatly affect the pace of mining and agricultural activity (together with their respective environmental impacts).

These two phenomena--looming resource scarcity, China's bubble--point in very different directions. One suggests a continuing boom in the consumption of natural resources, the other points toward a bust. I have to say that I credit the power of both of these forces, even though they point in contradictory directions. Though I would certainly like to know how this epic battle will play out over the next several years, the more important point for our purposes is simply that they are in play against the other, and that we should watch that saga like a hawk. 

The materials sector--the demand for things like copper, cement, iron ore, steel--would probably be more affected than the energy sector by Chinese troubles, but both would be affected. Over a longer time horizon--say, over the next three to seven years--growth in the rest of the developing world seems likely to moderate the effect of a Chinese financial bust, but, in the short term, mayhem in the commodities markets may ensue if China begins to slow. In the background of commodity speculation today is the memory of 2008, with its spectacular boom and bust in one year. It is not implausible to worry that markets might undertake a repeat performance. 

Here's a recent analysis from Buttonwood at the Economist summarizing the latest (mixed) research on China's "staggering non-performing loan problem."
Commerzbank tackles the issue of the property market in a note out today. In Beijing, the price-to-income ratio of the average home is 36; that compares with 18 in Singapore, 12 in New York and just 5 in Frankfurt. By itself, this isn't a reason to be immediately bearish. A high price-to-income ratio implies a belief that incomes will rise quickly and in China they are likely to do so; much harder to justify a high price-to-income ratio in London. Relative to GDP, Chinese house prices are not out of line with the last decade and of course, GDP is still growing very fast. 
Bubbles are also marked by speculative building. Chinese residential investment is around 8% of GDP, compared with a ratio of 5.8% for Japan in the 1980s. then again, China is modernising very rapidly so a degree of new build is to be expected. Commerzbank analyst Ashley Davies concludes that
The property market is not a true bubble in the style that Japan was in the late 1980s but is definitely guilty of exuberance.
Nouriel Roubini issued a broader note on the issue earlier this month. He argued that
No country can be productive enough to reinvest 50% of GDP in new capital stock without eventually facing immense overcapacity and a staggering non-performing loan problem. China is rife with overinvestment in physical capital, infrastructure and property. To a visitor, this is evident in sleek but empty airports and bullet trains, highways to nowhere, thousands of colossal new central and provincial government buildings, ghost towns and brand new aluminium smelters kept closed to prevent global prices from plunging.
The problem may not kick in until 2013, Mr Roubini thinks, saying the country will then suffer a hard landing. He adds that
All historical episodes of excessive investment - including East Asia in the 1990s - have ended with a financial crisis and/or a long period of slow growth.

April 27, 2011

Outsourcing Emissions

From Yale Environment 360:
Carbon emission reductions achieved since 1990 by the world’s developed nations were canceled out many times over by the increase of imported goods from nations without binding emissions targets, including China, according to a new report. While climate policies, including the Kyoto Protocol, stabilized carbon emissions in many wealthy nations from 1990 to 2008, most of these nations increased their “consumption-based” emissions significantly during this period because of large imports, according to the study, published in the Proceedings of the National Academy of Sciences. The study, which the authors call the first global assessment of how international trade affected national carbon footprints since Kyoto, says that while developed nations reduced their CO2 emissions by 2 percent from 1990 to 2008, those emissions actually increased by 7 percent when imports were factored in. “This suggests that the current focus on territorial emissions in a subset of countries may be ineffective at reducing global emissions without some mechanisms to monitor and report emissions from the production of imported goods and services,” said Glen Peters of the Centre for International Climate and Environmental Research and lead author of the study.

Malthusians v. Cornucopians, Doomsters v. Boomsters

Jeremy Grantham's letter cited in the preceding post recalled the famous bet between Julian Simon and Paul Ehrlich in 1980 over resource scarcity. It took the form of a wager on the price of five commodities a decade later, which Ehrlich lost. Here is a snippet from a John Tierney piece in the New York Times Magazine in 1990 summarizing that wager and the controversy it evoked, followed by a 2010 post from Gregor McDonald discussing Paul Kedrosky's take on "The Bet that Ruined the World."

Tierney:
In 1980 an ecologist and an economist chose a refreshingly unacademic way to resolve their differences. They bet $1,000. Specifically, the bet was over the future price of five metals, but at stake was much more -- a view of the planet's ultimate limits, a vision of humanity's destiny. It was a bet between the Cassandra and the Dr. Pangloss of our era. 
They lead two intellectual schools -- sometimes called the Malthusians and the Cornucopians, sometimes simply the doomsters and the boomsters -- that use the latest in computer-generated graphs and foundation-generated funds to debate whether the world is getting better or going to the dogs. The argument has generally been as fruitless as it is old, since the two sides never seem to be looking at the same part of the world at the same time. Dr. Pangloss sees farm silos brimming with record harvests; Cassandra sees topsoil eroding and pesticide seeping into ground water. Dr. Pangloss sees people living longer; Cassandra sees rain forests being decimated. But in 1980 these opponents managed to agree on one way to chart and test the global future. They promised to abide by the results exactly 10 years later -- in October 1990 -- and to pay up out of their own pockets. 
The bettors, who have never met in all the years they have been excoriating each other, are both 58-year-old professors who grew up in the Newark suburbs. The ecologist, Paul R. Ehrlich, has been one of the world's better-known scientists since publishing "The Population Bomb" in 1968. More than three million copies were sold, and he became perhaps the only author ever interviewed for an hour on "The Tonight Show." When he is not teaching at Stanford University or studying butterflies in the Rockies, Ehrlich can generally be found on a plane on his way to give a lecture, collect an award or appear in an occasional spot on the "Today" show. This summer he won a five-year MacArthur Foundation grant for $345,000, and in September he went to Stockholm to share half of the $240,000 Crafoord Prize, the ecologist's version of the Nobel. His many personal successes haven't changed his position in the debate over humanity's fate. He is the pessimist. 
The economist, Julian L. Simon of the University of Maryland, often speaks of himself as an outcast, which isn't quite true. His books carry jacket blurbs from Nobel laureate economists, and his views have helped shape policy in Washington for the past decade. But Simon has certainly never enjoyed Ehrlich's academic success or popular appeal. On the first Earth Day in 1970, while Ehrlich was in the national news helping to launch the environmental movement, Simon sat in a college auditorium listening as a zoologist, to great applause, denounced him as a reactionary whose work "lacks scholarship or substance." Simon took revenge, first by throwing a drink in his critic's face at a faculty party and then by becoming the scourge of the environmental movement. When he unveiled his happy vision of beneficent technology and human progress in Science magazine in 1980, it attracted one of the largest batches of angry letters in the journal's history. 
In some ways, Simon goes beyond Dr. Pangloss, the tutor in "Candide" who insists that "All is for the best in this best of possible worlds." Simon believes that today's world is merely the best so far. Tomorrow's will be better still, because it will have more people producing more bright ideas. He argues that population growth constitutes not a crisis but, in the long run, a boon that will ultimately mean a cleaner environment, a healthier humanity and more abundant supplies of food and raw materials for everyone. And this progress can go on indefinitely because -- "incredible as it may seem at first," he wrote in his 1980 article -- the planet's resources are actually not finite. Simon also found room in the article to criticize, among others, Ehrlich, Barry Commoner, Newsweek, the National Wildlife Federation and the secretary general of the United Nations. It was titled "Resources, Population, Environment: An Oversupply of False Bad News." 
An irate Ehrlich wondered how the article had passed peer review at America's leading scientific journal. "Could the editors have found someone to review Simon's manuscript who had to take off his shoes to count to 20?" Ehrlich asked in a rebuttal written with his wife, Anne, also an ecologist at Stanford. They provided the simple arithmetic: the planet's resources had to be divided among a population that was then growing at the unprecedented rate of 75 million people a year. The Ehrlichs called Simon the leader of a "space-age cargo cult" of economists convinced that new resources would miraculously fall from the heavens. For years the Ehrlichs had been trying to explain the ecological concept of "carrying capacity" to these economists. They had been warning that population growth was outstripping the earth's supplies of food, fresh water and minerals. But they couldn't get the economists to listen. 
"To explain to one of them the inevitability of no growth in the material sector, or . . . that commodities must become expensive," the Ehrlichs wrote, "would be like attempting to explain odd-day-even-day gas distribution to a cranberry." 
Ehrlich decided to put his money where his mouth was by responding to an open challenge issued by Simon to all Malthusians. Simon offered to let anyone pick any natural resource -- grain, oil, coal, timber, metals -- and any future date. If the resource really were to become scarcer as the world's population grew, then its price should rise. Simon wanted to bet that the price would instead decline by the appointed date. Ehrlich derisively announced that he would "accept Simon's astonishing offer before other greedy people jump in." He then formed a consortium with John Harte and John P. Holdren, colleagues at the University of California at Berkeley specializing in energy and resource questions. 
In October 1980 the Ehrlich group bet $1,000 on five metals -- chrome, copper, nickel, tin and tungsten -- in quantities that each cost $200 in the current market. A futures contract was drawn up obligating Simon to sell Ehrlich, Harte and Holdren these same quantities of the metals 10 years later, but at 1980 prices. If the 1990 combined prices turned out to be higher than $1,000, Simon would pay them the difference in cash. If prices fell, they would pay him. The contract was signed, and Ehrlich and Simon went on attacking each other throughout the 1980's. During that decade the world's population grew by more than 800 million, the greatest increase in history, and the store of metals buried in the earth's crust did not get any larger. . . . 
The bet was settled this fall [in 1990] without ceremony. Ehrlich did not even bother to write a letter. He simply mailed Simon a sheet of calculations about metal prices -- along with a check for $576.07. Simon wrote back a thank-you note, adding that he would be willing to raise the wager to as much as $20,000, pinned to any other resources and to any other year in the future. 
Each of the five metals chosen by Ehrlich's group, when adjusted for inflation since 1980, had declined in price. The drop was so sharp, in fact, that Simon would have come out slightly ahead overall even without the inflation adjustment called for in the bet. Prices fell for the same Cornucopian reasons they had fallen in previous decades -- entrepreneurship and continuing technological improvements. Prospectors found new lodes, such as the nickel mines around the world that ended a Canadian company's near monopoly of the market. Thanks to computers, new machines and new chemical processes, there were more efficient ways to extract and refine the ores for chrome and the other metals. 
For many uses, the metals were replaced by cheaper materials, notably plastics, which became less expensive as the price of oil declined (even during this year's crisis in the Persian Gulf, the real cost of oil remained lower than in 1980). Telephone calls went through satellites and fiber-optic lines instead of copper wires. Ceramics replaced tungsten in cutting tools. Cans were made of aluminum instead of tin, and Vogt's fears about America going to war over tin remained unrealized. The most newsworthy event in the 1980's concerning that metal was the collapse of the international tin cartel, which gave up trying to set prices in 1985 when the market became inundated with excess supplies. . . .
McDonald:
Paul Kedrosky has cleverly turned the famous 1980 Simon-Ehrlich wager on future commodity prices into a new teaching story, recasting the old lessons from that economist’s tete a tete into a false moral. In his interview here, with Andrew Keen, Paul explains that not only was the original bet limited to a not-very-useful 10 year timeframe, but worse, a generation of economists interpreted the wager’s outcome as law. Both points are worth making. As Kedrosky correctly points out, once you start moving the 10 year bracket forward from 1980 then Ehrlich, who bet on scarcity and lost, starts to win. Indeed, the winner of the wager was the beneficiary of timing, not insight. But leave it to economists to convert ephemeral conditions into permanent ones. While it’s true that both the price signal and technology can bring forth more supply of resources, often at lower costs, this is only true up to a limit. Once those limits are reached, as we have seen in global Copper and also Oil for example, then better technology might be able to create more supply on a nominal basis, but not at a lower price, and not in real terms. Anyone who has studied the chart of declining ore grades of Copper, or accepted the massive cost escalation in simply keeping global oil supply flat, will understand. 
Paul Kedrosky calls the Simon-Ehrlich wager The Bet That Ruined the World. As much as I like that phrasing, I am instead more excited with the possibility that Kedrosky’s recasting of Simon-Ehrlich will now supplant the antiquated, false teaching story originally derived from the bet. As the world now faces up to the fact that no cheaper substitute exists for the uber-dense 5.8 million BTU in a barrel of oil, a recasted Simon-Ehrlich is necessary to usher us more quickly to a confrontation with energy facts, and energy limits. Indeed, for Transitionists who dream of moving quadrillions of BTU demand, currently supplied by oil in global transport, over to a new electrified grid it behooves us to think harder about resources such as Copper. Like Kedrosky, and surely some of my readers, I have marveled over the possibilities of material upgrading and other technological wonders of resource substitution–the kinds of methods that often appear in presentations from places like MIT’s Solar Group. That said, we need to confront the fact that in conjunction with new lows in global copper ore grades, the price of copper–just like oil–has entered a new regime. Expecting a miracle of substitution in copper, or a price reversal downward away from the current regime, is certainly not realistic if we are on the threshold of hitting hard global copper resources to electrify world transport. Simon-Ehrlich recasted is another important step, therefore, towards the realism we need to actually solve the challenge of energy-transition.

April 26, 2011

The Great Paradigm Shift

Jeremy Grantham's quarterly investment letter is among the best in the business. Grantham is unusual in his field in having taken to heart the dangers of climate change; he has written in the past that the intersection between climate change and resource scarcity constitutes the chief investment problem of the coming generation. Grantham is notorious for having poured cold war on various investment manias of the past generation, the promoters of which invariably argued that "this time is different." In his latest letter, he insists that, so far as resource scarcity is concerned, this time is indeed different. Here is the short summary at the beginning of the letter:
The world is using up its natural resources at an alarming rate, and this has caused a permanent shift in their value. We all need to adjust our behavior to this new environment.  It would help if we did it quickly.
 Until about 1800, our species had no safety margin and lived, like other animals, up to the limit of the food supply, ebbing and flowing in population.

 From about 1800 on the use of hydrocarbons allowed for an explosion in energy use, in food supply, and, through the creation of surpluses, a dramatic increase in wealth and scientific progress.

 Since 1800, the population has surged from 800 million to 7 billion, on its way to an estimated 8 billion, at minimum.

 The rise in population, the ten-fold increase in wealth in developed countries, and the current explosive growth in developing countries have eaten rapidly into our finite resources of hydrocarbons and metals, fertilizer, available land, and water.   

 Now, despite a massive increase in fertilizer use, the growth in crop yields per acre has declined from 3.5% in the 1960s to 1.2% today. There is little productive new land to bring on and, as people get richer, they eat more grain-intensive meat. Because the population continues to grow at over 1%, there is little safety margin.

 The problems of compounding growth in the face of finite resources are not easily understood by optimistic, short-term-oriented, and relatively innumerate humans (especially the political variety).

 The fact is that no compound growth is sustainable. If we maintain our desperate focus on growth, we will run out of everything and crash. We must substitute qualitative growth
for quantitative growth.

 But Mrs. Market is helping, and right now she is sending us the Mother of all price signals. The prices of all important commodities except oil declined for 100 years until 2002, by an average of 70%. From 2002 until now, this entire decline was erased by a bigger price surge than occurred during World War II.

 Statistically, most commodities are now so far away from their former downward trend that it makes it very probable that the old trend has changed – that there is in fact a Paradigm Shift – perhaps the most important economic event since the Industrial Revolution.

 Climate change is associated with weather instability, but the last year was exceptionally bad. Near term it will surely get less bad. 
 Excellent long-term investment opportunities in resources and resource efficiency are compromised by the high chance of an improvement in weather next year and by the possibility that China may stumble.

 From now on, price pressure and shortages of resources will be a permanent feature of our lives. This will increasingly slow down the growth rate of the developed and developing world and put a severe burden on poor countries.

 We all need to develop serious resource plans, particularly energy policies. There is little time to waste.

Grantham buys into a range of arguments regarding peak oil, climate change, resource depletion, and agricultural shortfalls, but only for the medium to longer term. In the short term, he is much more cautious. The weather was so bad this past year (Russian drought, Australian floods, etc.) that--nature being mischeivous--it will probably get better next year. The big uncertainty, however, concerns what happens in China. China is responsible for an extraordinary share of the world's consumption of basic materials, and there is much in the Chinese investment boom that suggests a bust is coming. Grantham does not rule out a 2008 type scenario, in which commodity prices collapse along with economic growth. But then, he suggests, comes the mother of all buying opportunities. 


Update: 

Here's another chart, from the dry bulk shipper Genko, showing China's dominance of iron ore imports: 


April 24, 2011

Net Energy

One of the key concepts of the "peak oil" theory is that the energy return on energy invested (E.R.O.I., or net energy) has been declining over time. In the 1930s, with the discovery of giant oil fields, the return was over 100%; with biofuels, today, the return may be less than 1%. If, over time, it takes more energy to make energy, the result cannot fail to have adverse implications for economic growth and the standard of living. How to estimate net energy for any given sector necessarily involves a range of assumptions that may prove false; the estimates are inherently uncertain. But it is necessary to give it a try. One such effort is reproduced below, from Richard Heinburg's recent lecture on the end of growth:

April 23, 2011

IMF on Energy Scarcity


The International Monetary Fund's World Economic Outlook has a discussion of energy security (chapter three). The main conclusions:
The persistent increase in oil prices over the past decade suggests that global oil markets have entered a period of increased scarcity. Given the expected rapid growth in oil demand in emerging market economies and a downshift in the trend growth of oil supply, a return to abundance is unlikely in the near term. This chapter suggests that gradual and moderate increases in oil scarcity may not present a major constraint on global growth in the medium to long term, although the wealth transfer from oil importers to exporters would increase capital flows and widen current account imbalances. Adverse effects could be much larger, depending on the extent and evolution of oil scarcity and the ability of the world economy to cope with increased scarcity. Sudden surges in oil prices could trigger large global output losses, redistribution, and sectoral shifts. There are two broad areas for policy action. First, given the potential for unexpected increases in the scarcity of oil and other resources, policymakers should review whether the current policy frameworks facilitate adjustment to unexpected changes in oil scarcity. Second, consideration should be given to policies aimed at lowering the risk of oil scarcity.
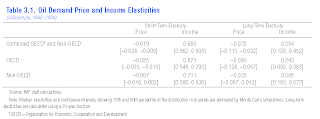
Perhaps the most surprising conclusion is the remarkably low price elasticities estimated for oil consumption. (Elasticity refers to how people respond to prices. A low number, as below, means that they keep buying the product regardless. A high number means that they cut back.)
The combined results for OECD and Non-OECD countries suggest very low short-term price elasticity, about –0.02 (Table 3.1). This implies that a 10 percent increase in oil prices leads to a reduction in oil demand of only 0.2 percent. Although the long-term price elasticity is about four times larger, the number is still small, which implies that a 10 percent permanent increase in oil prices reduces oil demand by about 0.7 percent after 20 years.
Income elasticity measures the effect on the consumption of a given product assuming an increase in income. A high number, as below, means that consumption rises in parallel with income.
The short-term income elasticity is about 0.68, implying that a 1 percent increase in income is associated with an increase in oil demand of 0.68 percent. The long-term elasticity is considerably smaller, at 0.29. This result indicates that oil consumption has been considerably less income-elastic than primary energy demand, which means that the world economy has been (slowly) substituting away from oil. In addition, the fact that income elasticity is higher in the short term than in the long term suggests that the response of oil consumption to an income shock involves some cyclical overshooting.
Initial responses, such as those during the global recovery of 2009–10, therefore may not be representative of longer-term trends. The growing importance of emerging market economies appears to have reduced world oil demand price elasticity (in absolute terms) and increased income elasticity. . . .

 The Early Warning blog comments on the incredibly low elasticities projected by the IMF:
I've tended to be an inelasticity hawk, but these numbers are really eye-popping. -0.007 for emerging market oil price inelasticity! That implies a 10% increase in oil prices produces a negligible 0.07% decrease in consumption. That's the short term number, but even the 20 year horizon is only -0.035. Meanwhile, short term global income elasticity is 2/3. So that 4% economic growth requires 2 1/3% annual increases in oil production to keep prices stable. . . . 
Note that these IMF estimates are based on the 1990-2009 interval. This was a period of generally low oil prices, except for a single price spike from 2005-2008 or so, and very widespread access to credit in developed countries.  
Access to credit is now more constrained, forcing some people to economize, rather than being in a position to borrow in order to bid prices of perceived necessities higher. This will make demand more elastic. 
Adaptation as a result of the 2005-2008 price spike was very limited (eg the impact on the US fuel economy averages was quite subdued). Experience from the 1970s was that the really big changes came after the second shock (in 1979/1980), rather than the first (in 1973/74). It may work the same way now. 
In particular, if oil prices go high enough, often enough, we would expect that to trigger large scale switching of transportation options to plugin-hybrids, compressed natural gas, etc. It will also promote more use of smaller cars, scooters, electric bicycles, etc.
For all these reasons, I expect elasticities in the next twenty years to be higher than in the last twenty.
Given these tiny reductions in demand stemming from increases in price, the implications of a decline in energy production are pretty startling. Early Warning (Staniford) notes that it basically fractures the models and goes on to cite the IMF's speculations on what declining supply would mean for price:
Another alternative scenario considers the implications of a more pessimistic assumption for the declines in world oil output—3.8 percent rather than 1 percent annually—accompanied by a 4 percent annual increase in real extraction costs per barrel rather than 2 percent (Figure 3.11). This implies that, barring any increase due to the supply response to higher prices, oil production declines by 2 percent annually—a scenario that reflects the concerns of peak oil proponents, who argue that oil supplies have already peaked and will decline rapidly.30 In this scenario, the longer-term output and current account effects are roughly three to four times as large as in the benchmark scenario, meaning they increase roughly in proportion to the size of the shock. Declines in absorption in oil importers are now on the order of 1.25 to 3 percent annually over the period shown, while in oil exporters, domestic absorption increases by more than 6 percent annu- ally. Current account deterioration in oil importers is also much more serious, averaging 6 to 8 percentage points of GDP over the long term. 
The most striking aspect of this scenario is, however, that supply reductions of this magnitude would require an increase of more than 200 percent in the oil price on impact and an 800 percent increase over 20 years. Relative price changes of this magnitude would be unprecedented and would likely have nonlinear effects on activity that the model does not adequately capture.  
A few days later, Early Warning commented further on the curious assumptions in the IMF report. Over the next five years, the IMF projects a world growth rate of 4.5% a year. If, as the IMF assumes, the income elasticity for oil is .685, that means that consumption would grow at 68% of the overall world growth rate, or about 3% a year.  EW shows, graphically, what that would mean:


As EW comments, such growth seems very unlikely. The red line in the graph, based on the IMF projection of a .685 income elasticity
requires the world come up with another 17mbd of supply in the next five years, though it only managed to come up with about 3-4mbd over the last five years, and that took a quadrupling of prices to achieve. I don't see where this much oil can possibly come from. Saudi Arabia is saying they aren't going to increase production much if at all in the next five years. Russia is pretty much plateaued. The US is long past peak, and will be lucky to avoid further declines. Iraq is the one hope for truly large increases in oil supply, but that increase has just barely started, and is not going to amount to more than a few mbd over the next five years.

The green curve looks at what happens if you say that oil prices will not be constant, but instead will increase by enough to make supply grow at 1% less per year than the red curve. That way we only need another 11mbd, instead of 17mbd. That's still an implausibly large amount of oil. But even that causes huge problems if we take seriously the short term price elasticity of -0.019 in the IMF's table 3.1 above. That means that to reduce supply by 1%, we need to increase price by 1/0.019 = 53%. Each year. As you might imagine, prices rise to ludicrous heights in no time:

The conclusion? There is no way to square the IMF's projection of world economic growth with its projection of the effect of such growth on oil prices or consumption. Instead, economic growth produces a startling increase in oil prices, which in turn induces recession. That brings oil prices down, temporarily, but the constraints on oil supply operate, over time, as a fundamental constraint on economic growth. If oil supply remains flat or grows slowly, there is an immense challenge in improving the efficiency with which the world's economies use oil. Given enormous fixed investments in the transportation sector, where most of the oil is used, that can't be done overnight. Reducing oil usage, under those circumstances, requires a contraction of economic activity. In the medium to longer term, undoubtedly, much greater efficiencies are possible. People buy more fuel efficient cars or move closer to their place of employment. There is, however, little evidence that most governments--certainly not the American government!--will anticipate these constraints. They will change when they are forced to change, after being hit over the head with a two-by-four, not before.

April 21, 2011

Nuclear Power Viable Only When Uninsured

From the Associated Press:

From the U.S. to Japan, it’s illegal to drive a car without sufficient insurance, yet governments around the world choose to run over 440 nuclear power plants with hardly any coverage whatsoever.


Japan’s Fukushima disaster, which will leave taxpayers there with a massive bill, brings to the fore one of the industry’s key weaknesses — that nuclear power is a viable source for cheap energy only if it goes uninsured.


Governments that use nuclear energy are torn between the benefit of low-cost electricity and the risk of a nuclear catastrophe, which could total trillions of dollars and even bankrupt a country. 
The bottom line is that it’s a gamble: Governments are hoping to dodge a one-off disaster while they accumulate small gains over the long-term.


The cost of a worst-case nuclear accident at a plant in Germany, for example, has been estimated to total as much as €7.6 trillion ($11 trillion), while the mandatory reactor insurance is only €2.5 billion. 
“The €2.5 billion will be just enough to buy the stamps for the letters of condolence,” said Olav Hohmeyer, an economist at the University of Flensburg who is also a member of the German government’s environmental advisory body.


The situation in the U.S., Japan, China, France and other countries is similar. 
“Around the globe, nuclear risks — be it damages to power plants or the liability risks resulting from radiation accidents — are covered by the state. The private insurance industry is barely liable,” said Torsten Jeworrek, a board member at Munich Re, one of the world’s biggest reinsurance companies. 
In Switzerland, the obligatory insurance is being raised from 1 to 1.8 billion Swiss francs ($2 billion), but a government agency estimates that a Chernobyl-style disaster might cost more than 4 trillion francs — or about eight times the country’s annual economic output.


A major nuclear accident is statistically extremely unlikely when human errors, natural disasters or terror attacks are excluded, but the world has already suffered three in just about thirty years — Three Mile Island, Chernobyl and now Fukushima.


In financial terms, nuclear incidents can be so devastating that the cost of full insurance would be so high as to make nuclear energy more expensive than fossil fuels. . . .


As Japan’s disaster at the Fukushima Dai-ichi plant unfolds in the wake of the March 11 earthquake and tsunami, it is still unclear what the final cost might be.


Operator Tepco’s shares have been battered, and analysts say Japan — which already has the highest debt level among the world’s industrialized nations — might eventually have to nationalize the company, and take on its massive liabilities.


Tepco had no disaster insurance.


The majority of Germans and the political parties have concluded that the potential damage outweighs the benefits, and the country now stands alone among industrialized nations in its determination to overcome nuclear power.


Phasing out nuclear energy — which like in the U.S. produces a quarter of the country’s electricity — was meant to happen slowly over the next 25 years. But in the wake of Fukushima the government seems determined to speed things up, possibly pulling the plug on the last reactors within a decade, gradually replacing them with renewable energies.


“No society has to bear the potentially enormous risk of a nuclear disaster,” Hohmeyer said.

April 18, 2011

One Year Later: Assessing Impact of Deepwater Horizon

Carl Safina, at Yale Environment360, summarizes the damage, much less than had been feared:
It’s been a year since the blowout in the Gulf of Mexico — so a little hindsight is now in order. Recklessness caused the worst unintended release of oil ever; lives were lost and permanently changed. By definition, we won’t know the long-term consequences until the long term. Scientific studies are ongoing. Some government findings are being held as potential evidence in court cases, distorting the usual scientific atmosphere that seeks understanding through openness. Frustratingly, as of now, many questions remain.

And there may be some surprises. Most people feared major die-offs of fishes and shrimp in the northern Gulf. But when areas closed because of oil were reopened to fishing, fishing was generally excellent. A season closed to fishing may have done more to help the fish than the oil did to hurt them. 
While the oil was flowing, fewer dolphins died than many had feared; it seemed they perhaps dodged the brunt of the oil. But in March and April of this year, newborn dolphins were washing up dead in high numbers in the northern Gulf — a very unpleasant surprise, but not unprecedented. Did the oil kill them? An unrelated infectious disease? Were they more susceptible to disease because of the oil? No one knows.

The Gulf is the only nesting area for Kemp’s Ridley turtles — the world’s most endangered sea turtle. Many turtles that washed up, including Kemp’s Ridleys, showed no visible signs of oil. Did fishing nets kill them? And of those that did die in oil, how many went undetected? 
In other oil spills, a rough rule of thumb is that for every carcass found, nearly ten times that number go undetected. According to the New York Times, researchers are now dropping bird carcasses offshore to see how many will sink and how many will wash ashore, which may help them determine how many birds were killed by oil beyond those that were found.

And while most people did not get sick, a disturbing number of individuals — perhaps more sensitive or more exposed — continue to complain of significant health problems since the blowout and the spill. 
The deep plumes have already dissipated, apparently eaten by the Gulf’s oil-adapted microbes. Yet some of that deep oil seems lodged in seafloor sediments, and, up to seven miles from the wellhead, it appears to have killed some deep-sea coral.

But was it, as was often said, “the worst environmental catastrophe in American history”? Well, no. Many people feared the blowout would kill the great marshes of the Mississippi Delta. Some even feared it would kill off the whole ocean, or worse. But while the blowout wasn’t the ongoing ecological catastrophe that some predicted, there exist much bigger long-term problems we don’t fear nearly enough. . . .

April 16, 2011

Water Priorities

From an NPR interview with Charles Fishman, author of The Big Thirst: The Secret Life and Turbulent Future of Water:
"The last 100 years has been the golden age of water in the developed world: water that has been safe, unlimited and essentially free," he tells Fresh Air's Terry Gross. "But that era is over. We will not, going forward, have water that has all three of those qualities at the same time: unlimited, unthinkingly inexpensive and safe." 
Currently, one out of six gallons of water acquired, treated and pumped by water utilities in the U.S. leaks back into the ground before it can be used by a home or business. This, says Fishman, will change — but only if technology at water utility companies starts to improve. 
"Water utility companies are run the same way they were 30 or 40 years ago," he says. "They don't understand what's going on in their own pipes. As technology allows us to see what's happening to the water in the water system — whether it's in a factory, university or whole ecosystem — we'll be able to manage that water much more smartly." . . . 
"The average U.S. home pays an average of $34 a month. So our always-on, unlimited, almost universally reliably safe water costs us about $1 a day. Our water bill is less than half what our cable TV bill or our cell phone bill is. So cities are starved for financial resources and water utilities are often in terrible shape. In Philadelphia, there are 3,300 miles of water mains in the city, and they replace 20 miles a year. They're on 160-year replacement cycles. One of the officials from the Philadelphia water utility said to me, 'We want to make sure we get the 20 miles right.' That's not a question of money, it's a question of public resistance to digging up streets." 
Fishman subsequently did an interview with the New York Times in which he commented on the extraordinary success of Las Vegas in putting water to good use:

Las Vegas has quietly become the most water-smart city in the U.S. By outlawing front lawns in new homes, by paying residents and businesses $40,000 an acre to remove grass, by imposing water budgets on golf courses, Las Vegas has dramatically changed water use patterns. Las Vegas now recycles 94 percent of all water that hits an indoor drain anywhere — cleaning it and sending it back to Lake Mead. No U.S. city matches that. And water use in Las Vegas has fallen 108 gallons per person in two years. Las Vegas today uses almost exactly the same amount of water as 10 years ago — but it has grown 50 percent in population. The fountains, lagoons and topless swimming pools notwithstanding, that’s an incredible achievement — something every U.S. city could learn from.   
The best news, in fact, is in the biggest picture. The U.S. as a nation uses less water in 2011 than it did in 1980. We use less water to produce an economy of $13 trillion than we did to produce an (inflation-adjusted) economy of $6 trillion.   
That’s incredible. The country over all has doubled its water productivity — which means that it’s possible to continue to grow and modernize, while actually reducing the amount of water we use.

April 15, 2011

Shale Gas Not So Bad

A new study by Robert Howarth of Cornell University (a preliminary version of which was cited here) argues that natural gas emissions from shale, considering all the methane leakage it entails, contributes more to greenhouse gas emissions than coal. If true, the idea has profound implications for energy policy and undercuts widely held beliefs in the environmental and energy community. As Michael Levi notes, however, the study is based on weak data and makes dubious choices in methodology:
First, the data for leakage from well completions and pipelines, which is where he’s finding most of his methane leaks, is really bad. Howarth used what he could get – figures for well completion leakage from a few isolated cases reported in industry magazines, and numbers for pipeline leakage from long-distance pipelines in Russia – but what he could get was very thin. There is simply no way to know (without access to much more data) if the numbers he uses are at all representative of reality. 
Second, Howarth’s gas-to-coal comparisons are all done on a per energy unit basis. That means that he compares the amount of emissions involved in producing a gigajoule of coal with the amount involved in producing a gigajoule of gas. (Don’t worry if you don’t know what a gigajoule is – it doesn’t really matter.) Here’s the thing: modern gas power generation technology is a lot more efficient than modern coal generation, so a gigajoule of gas produces a lot more electricity than a gigajoule of coal. The per kWh comparison is the correct one, but Howarth doesn’t do it. This is an unforgivable methodological flaw; correcting for it strongly tilts Howarth’s calculations back toward gas, even if you accept everything else he says.
Third, the problems with gas that Howarth flags have cheap technological fixes (green well completion techniques, better pipeline care), though there may be institutional barriers to implementing them. If we scale up gas and realize we have an emissions problem, there are things we can do. The only technological fix for coal, in contrast, is CCS, which isn’t commercial yet; if we decide we want to fix our coal problem, it’s not clear we have any options.
The fourth question, which has been getting a lot of attention (perhaps most of it), is Howarth’s decision to use 20 year global warming potentials (GWPs) to compare coal with gas, rather than the customary 100 year figures. Basically, the purportedly high lifecycle emissions of gas are due to methane leakage. Methane is a potent greenhouse gas, but decays in the atmosphere on scales of decades, in contrast with carbon dioxide, which decays on the century scale. This means that if you average the impact of GHG emissions over 20 years instead of 100, it boosts the relative influence of methane, and hence the downsides to gas.  
Lots of people have been going after Howarth for his unorthodox approach on this front. I have to admit, though, that this is one where I’m not so sure that he’s as wrong as his critics claim. I’ve been a big fan, for example, of efforts to cut near term emissions by targeting black carbon and ozone – but you can’t really justify the value of such measures unless you look at short term GWPs, since these are very short lived species. And given a lot of the rhetoric out there about nearish-term tipping points, it also isn’t entirely clear to me that it’s consistent to turn around and say that we should only look at impacts averaged over a hundred years. Over at NRDC’s blog, Dan Lashof (who I hear wrote his PhD dissertation on GWPs) suggests that a 50-year timeframe is best. This makes as much sense as anything else. 
One last comment: I worry about what this paper says about the peer review process and the way the press treats it. This article was published in a peer-reviewed journal that’s edited by talented academics. It presumably got a couple good reviews, since its time from submission to publication was quite short. These reviewers don’t appear to have been on the ball. Alas, this sort of thing is inevitable in academic publishing. It’s a useful caution, though, against treating peer review as a mark of infallibility, as too many in the climate debate – both media and advocates – have done.
Howarth and Levi subsequently got into an exchange on Levi's blog. A key point by Levy: "the technical fixes for gas are a heck of a lot cheaper (and politically more feasible) than the technical fixes (ie CCS) for coal."

A later post by Levy points to a May 12, 2011 study by the the Department of Energy’s National Energy Technology Laboratory (NETL) that also overturns Howarth's conclusion. "Used to generate electricity, natural gas – conventional or not – results in far less emissions than coal," says NETL.

5/20/11

April 4, 2011

After Fukushima, Difficult Choices for China

From the Carnegie Endowment
While China’s installed nuclear power plant capacity reached only 10.8 Gigawatt (GW) by the end of last year, Beijing plans to increase its capacity to 40 GW by 2020, according to the Medium- to Long-term Development Plan for Nuclear Power issued by China’s National Development and Reform Commission in 2007. Some widespread reports say the Chinese government may revise the 2020 target upward to 70 to 86 GW, while several experts in the Chinese nuclear industry claim that a 100 GW level is achievable by that time.
In the wake of Japan’s nuclear crisis, on March 16 Beijing halted approvals of new nuclear power plants pending changes to safety standards. This move signaled a shift toward caution from a country that is embarking on the world’s biggest nuclear expansion program but where public fears of nuclear contamination are growing. Such concern was best illustrated by a recent panicked nationwide buying spree of iodized salt—even though a few kilograms of iodized salt per day is necessary to prevent the possible thyroid cancer caused by ingesting a hypothetically high level of iodine emissions that do not yet exist in China. In addition, the State Council has ordered safety checks at existing plants. . . .

Considering energy demand increases due to economic growth, burgeoning air pollution, increasingly vulnerable energy security, and mounting political pressure to mitigate climate change, the Chinese government has no easy solution to meet these simultaneous challenges. Not surprisingly, decision makers are used to making difficult tradeoffs among various energy sources: coal, which is carbon-intensive and dirty; oil, which poses national security concerns and pollutes the environment; gas, which is scarce and costly to develop; large-scale hydro power, which is ecologically devastating; nuclear, which is technologically risky; and renewables, which are often not only expensive but also intermittently available.

During China’s twelfth Five Year Plan period, which covers 2011 to 2015, the government plans to slow air-quality deterioration and coal-consumption increases while reducing carbon emissions intensity by 17 percent. Without further increasing its domestic nuclear power capacity, China will have a much more difficult time meeting its vitally important environmental targets under this plan. . . .

Nigeria: Another Crisis Brewing

From the Wall Street Journal
The civil war raging in Libya and unrest across the Middle East pushed oil to triple digits in recent weeks. But the threat of disruptions to Nigeria's 2.2 million barrels a day of crude output has barely factored into prices, despite a history of attacks on the West African nation's oil infrastructure during election season.
"It's not on the market's radar," said Barclays Capital oil analyst Amrita Sen.

Nigerians will vote for their president, representatives to their national assembly and governors of the country's 36 states over the next four weeks, but there have already been problems. On Saturday, Nigeria postponed parliamentary elections due to failed logistics, and on Sunday pushed back all votes one week.

Police, military and other security agencies are being deployed nationwide after political rallies turned violent over the past month. And rebel groups have already acted.

More than 10% of U.S. oil imports come from Nigeria, according to Department of Energy, so any supply drops would be taxing for U.S. energy consumers data. In January, the U.S. imported 968,000 barrels a day from the country, making Nigeria the fourth-largest oil supplier after Canada, Saudi Arabia and Mexico. . . .

In Nigeria, a blast on March 16 rocked an oil facility run by the subsidiary of Italian energy major Eni SpA. The Movement for the Emancipation of the Niger Delta, a militant umbrella group, claimed responsibility and pledged further action.

The attack is a reminder of the supply disruptions that came with Nigeria's 2007 elections. Attacks on the country's oil infrastructure stopped the flow of as much as one million barrels a day of oil, forcing customers to scramble for supplies and leaving oil consumers wary of buying Nigerian crude for fear of future disruptions.

A supply drop of that magnitude could add as much as $8 a barrel to current prices, said Andy Lipow, president of oil-trading adviser Lipow Oil Associates.

It is troubling for the U.S. market ahead of summer-driving season. Domestic refineries rely on Nigeria's coveted, low-viscosity crude to boost their output of gasoline. Roughly 40% of Nigeria's exports flow to the U.S.

But so far, the market has kept its gaze centered on Libya. Fighting between rebels and forces loyal to Moammar Gadhafi over the past month has curtailed the country's 1.6 million barrels a day of oil production, with Saudi Arabia and others pledging to make up for the lost supplies.

"Every day, what goes on in Libya is taking precedence over what's happening anywhere else, even Nigerian elections that are only two weeks away," said Phyllis Nystrom, an energy-markets analyst with Country Hedging. . . .
However, as Steve Levine notes, matters may not turn out that bad:
The Movement for the Emancipation of the Niger Delta, or MEND, the most active militant group operating in the oil-rich Niger Delta, has retracted a threat to attack oil installations during the election period, according to local on-line The Nation. Authorities are better-prepared for what trouble does arise, reports Agence France Press. "There will be pockets of violence," Victor Ndukauba, an analyst with Afrinvest Advisers, told the French agency. "However, there is much better awareness of a lot of the [militant] foot soldiers. ... There will be violence, but we don't think it will be as bad." Some analysts actually think that the country will increase production in the coming weeks and months by some 300,000 barrels a day.

April 2, 2011

Shale Gas Boom

From Daniel Yergin, author of The Prize and head of Cambridge Energy Research Associates, writing in the Wall Street Journal:
What has become known as the "unconventional-natural-gas revolution" has turned a shortage into a large surplus and transformed the natural-gas business, which supplies almost a quarter of America's total energy. This revolution has arrived, moreover, at a moment when rising oil prices, sparked by turmoil in the Middle East, and the nuclear crisis in Japan have raised anxieties about energy security. Government and producers alike have turned their attention back to domestic resources.

The rapid rise of shale-gas production has also drawn scrutiny and controversy. Some environmental groups say that the process threatens to contaminate drinking-water supplies. The industry, for its part, points to a long safety record, with some form of fracking having been used in more than a million wells in the U.S. since the end of the 1940s.

As late as 2000, shale gas was just 1% of American natural-gas supplies. Today, it is about 25% and could rise to 50% within two decades. Estimates of the entire natural-gas resource base, taking shale gas into account, are now as high as 2,500 trillion cubic feet, with a further 500 trillion cubic feet in Canada. That amounts to a more than 100-year supply of natural gas, which is ued for everything from home heating and cooking to electric generation, industrial processes and petrochemical feedstocks.

The effects of the "shale gale" are also being felt in the rest of the world, changing the economics of the liquefied-natural-gas business. Its impact on international energy relations could be significant. Some proponents believe that the U.S., once thought to be short of natural gas, could even become a natural-gas exporter. . . .

Thanks to shale gas, overall U.S. natural-gas production went up from 2007 to 2008. That was the signal to the rest of the energy industry, and larger companies were soon turning to shale. It was not until the fall of 2009, however, that leaders in the nation's capital woke up to the fact that something was changing in the U.S. energy mix. It's now well-recognized. In his energy speech on Wednesday, President Barack Obama said, "Recent innovations have given us the opportunity to tap large reserves—perhaps a century's worth—in the shale under our feet. The potential here is enormous."

In the energy industry, use of the new technology quickly gathered speed. The know-how was applied across North America, in such shale formations as Haynesville, mostly in Louisiana; Eagle Ford in South Texas; Woodford in Oklahoma; Horn River and Montney in British Columbia; Duvernay in Alberta; and the "mighty Marcellus," the huge formation that spreads from Pennsylvania and New York down into West Virginia.

Gas output rose dramatically, and the anticipated shortfall turned into a large surplus. As the volume rose, the inevitable happened—prices came down. Substantially. Today, natural-gas prices are less than half of what they were just three years ago.

Shale gas changed the strategic direction of the industry. Larger companies have maintained their commitment to existing multibillion-dollar liquefied-natural-gas projects around the world, but they now intend that gas for markets in Europe and Asia, not North America. At the same time, they have made new multibillion-dollar investments in shale-gas extraction in North America.

Outside the U.S., potential reserves of shale gas have been identified in countries from Mexico and Argentina to Algeria. Chinese interest is rising swiftly, both for shale gas and for another form of unconventional natural gas, coal-bed methane. It is now thought that Europe's unconventional-gas potential may be as great as North America's.

Even with increased energy efficiency over the next two decades, growing demand for power in the U.S. could require the equivalent of 540 new coal plants or 200 new nuclear power plants. Coal is inexpensive and abundant, but there is regulatory and environmental opposition to its use because of carbon and other emissions. Nuclear power is carbon-free and has evolved new passive safety features, but it is expensive and, especially after the catastrophe in Japan, faces regulatory and political uncertainty.

In most states, utilities are now required to have a certain share of renewable energy sources. Most of it has been wind power, but wind is still small-scale and relatively expensive. Because it supplies energy only intermittently, it can be difficult to integrate into the electric grid.

Further complicating the picture for all of these rival energy sources is uncertainty about what kind of new carbon regulations might come from Congress and the Environmental Protection Agency.

Power companies have been reluctant to make a larger commitment to natural gas because of worries about supply and price volatility. Over the past 30 years, natural gas has been, at different times, abundant and cheap or scarce and expensive. Utility executives made commitments in the late 1990s to what was supposed to be cheap natural gas, only to see prices spike as supplies tightened, contributing to the California power crisis and sending some companies into bankruptcy.

But shale has changed the equation. Abundant, relatively low-priced supplies now make natural gas a highly competitive alternative to both nuclear and wind power and even to coal generation. It has the added advantage of being relatively low-carbon (though even natural gas will be constrained if the U.S. adopts a policy similar to the European Union's objective of an 80% reduction in carbon emissions by 2050).

Could natural gas also be a game changer for transportation? That is much more of a challenge. Automakers and the fuel-supply industry are already dealing with a multitude of imperatives—more fuel-efficient cars, more biofuels, plug-in hybrid electric vehicles, pure electric vehicles. Making a major push for natural-gas vehicles would add yet another set of mandates and incentives, including the creation of a costly new fueling infrastructure.

Moreover, the price advantage of natural gas over gasoline shrinks as cars become more fuel-efficient. The most obvious growth area for natural gas in transportation is for urban fleets (taxis, buses and other service vehicles) that have access to a central refueling facility. Some argue for adding long-distance trucks to that list. But if there is a strong large-scale push in general transportation, it might make the power industry fearful of having to compete against motorists for natural-gas supplies and thus more cautious about making a major commitment themselves.

The arrival of shale gas has received a mixed welcome from environmentalists. Some applaud it as a lower-carbon source of electricity. It is also an "enabler" for renewable energy, providing a source of electricity that can step in to fill the gap when the wind is not blowing or the sun is not shining. "The sudden abundance of low-cost natural gas is a gift," said Tim Wirth, president of the United Nations Foundation, who, as a U.S. senator, ran the hearings that turned climate change into a national issue. "But it is a gift that has to be managed properly." Mr. Wirth, like other pro-gas environmentalists, has called on the industry to set standards and create an operating compact with regulators.

Criticism of shale gas by some environmentalists has risen as operations have spread into regions that are largely unfamiliar with modern oil and gas drilling. Some worry about the amount of water used in the process. But last year, the 3,500 shale-gas wells drilled in the U.S. used only about 0.02% of total water used in the U.S.

Concerns also have been raised about the possibility that hydraulic fracturing could contaminate the aquifers that supply drinking water. But fracking occurs below drinking-water aquifers, separated by a mile or more of impenetrable rock.

In Texas, the birthplace of the shale-gas revolution, there is currently a stand-off between the federal Environmental Protection Agency and the state Railroad Commission, which regulates oil and gas production. The EPA maintains that two water wells in Parker County, west of Fort Worth, were contaminated by gas from hydraulic fracturing more than a mile below it. The Texas Railroad Commission, using chemical fingerprinting, maintains that the EPA is wrong and that the gas seeped into the well from a shallow formation a few hundred feet beneath the surface, much closer to the water wells.

Environmental attention has recently shifted to the wastewater that comes back to the surface during drilling. As in any industrial activity, this water has to be either recycled or disposed of in an environmentally appropriate way. In many parts of the country, companies inject the wastewater into deep disposal wells.

It is not clear whether Pennsylvania has enough of the deep geological formations necessary for such disposal. For the vast Marcellus shale, the issue is whether the state's wastewater treatment facilities are adequate and can keep up with the pace of expansion in shale drilling. The industry has moved to increase the amount of wastewater recycled in drilling operations, currently at over 70% by some estimates.

The extraction of oil and gas is a highly regulated activity. Historically, the actual drilling, including fracking, has been regulated by states. Virtually all disposal of wastewater is regulated by the EPA, either under the Safe Drinking Water Act or the Clean Water Act, but the EPA may delegate actual enforcement of these regulations to the states.

In an era of heightened environmental awareness, any incident, even involving a single water well, can become a national event. As a recent analysis from the Massachusetts Institute of Technology Energy Initiative put it, "With over 20,000 shale wells drilled in the last 10 years, the environmental record of shale-gas development is for the most part a good one. Nevertheless, one must recognize…the damage that can be caused by just one poor operation."

Debates will continue about state versus federal regulation, industry standards and the underlying facts in particular cases. What many analysts expect to see is the emergence of a set of "best practices," endorsed by both regulators and industry, that are tailored to the specific characteristics of the diverse basins across the country. For shale gas production to succeed on a massive scale, public confidence will be essential.

All of these issues have emerged relatively recently, and it will take some time to sort them out. But we should not lose sight of the larger picture: the potential for a century's worth of inexpensive, environmentally attractive energy. At a time of increased energy anxiety, the shale gas revolution is both a major innovation and a formidable new addition to our energy supply.
* * *

Daniel Yergin, "Stepping on the Gas," Wall Street Journal, April 2, 2011